Fieldwork numeracy: traffic measurements

A clear and highly practical resource to practise numerical skills and graphical skills at GCSE.
The worksheet guides students through calculating the mean and the range of two different data sets, with worked examples to help them. They then choose the best way to present the data, and they complete a bar graph and a line graph.
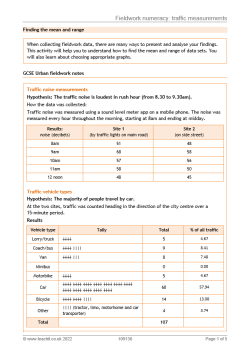
The data was collected in response to the hypotheses 'The traffic noise is loudest in rush hour' and 'The majority of people travel by car'.
Answers are provided.
A sample from the resource:
- Range: the range of a data set means the difference between the highest and lowest values
|
Worked example: For site 1, the lowest decibel recording was 48 and the highest was 68. 68 – 48 = 20 decibels |
Your turn: For site 2: the lowest decibel recording was .................................................................... and the highest was .................................................................... . ............... – ............... = ............... decibels |
